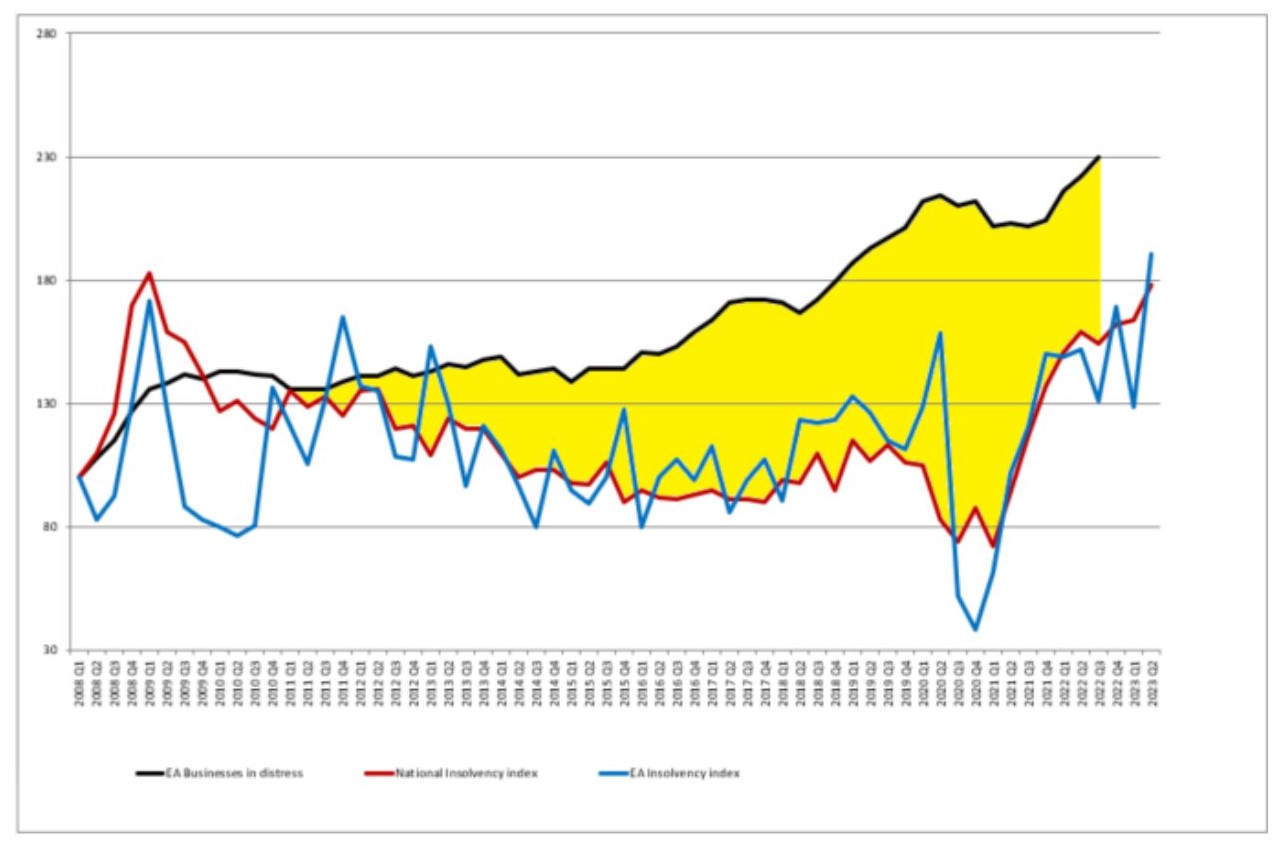
Corporate insolvencies and business distress index
This chart shows corporate insolvencies from Q1 2008 to Q2 2023.
The red line shows National insolvencies, the blue local insolvencies and the black line businesses in distress as an index of 100 starting Q1 2008 and it shows a bit of a roller coaster ride.
It starts at the end of a long boom with corporate insolvencies at historic lows. Then the Global Financial Crisis in 2008/2009 shows a sharp increase in corporate insolvencies followed by an equally sharp recovery, then follows a gradual drift down until 2018 during the boom years with ultra-low interest rates and rounds of quantitative easing.
As corporate insolvencies start to normalise Covid Government business support sees corporate insolvencies at historic lows but when that support stops corporate insolvencies rise and rise again more recently with increased interest rates and the cost of living crisis.
The black line is our business distress index of SME companies in East Anglia in distress with net liabilities, net current assets and a negative trend in shareholder funds.
You can see that the corporate insolvencies are now at around the level they were at the height of the Global Financial Crisis and all the lines are pointing up and look set to go higher.
Business in Distress Index (with gap between businesses in distress and National stats highlighted in yellow)